
By Bob Glaser ©2014
The two primary types of the information that we use in UX design is the raw data that is quantitative and the experiential (or qualitative data.) When I was in college, one of the things I studied was music (mostly music theory and orchestration.) This was because I discovered in an odd and roundabout way, classical music, or more accurately, orchestral music. I had learned to read orchestral scores (those giant tomes of music on the conductors stand.) It showed what exactly what the composer wrote for every single instrument in that big orchestra. This was not a simple feat since there are times when massive amounts of information need to be processed at one time.
In the picture below is a page from a score which is three measures long, lasting about 14 seconds. Every instrument is clearly defined following the standards of a conductors score for the time.
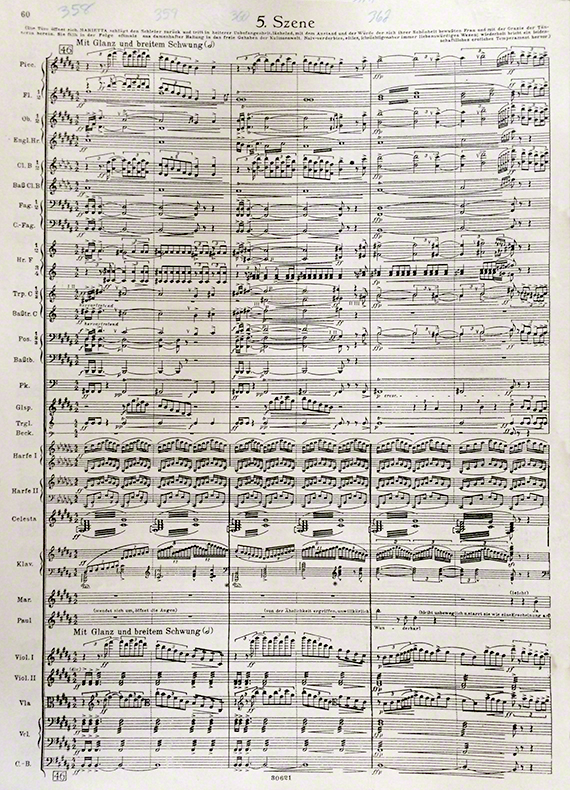
Marietta’s entrance in “The Dead City” by E.W. Korngold
(I created this recording using 59 tracks for all of individual parts.)
The entire page is read left to right. A vertical line extending from the top to the bottom moving left to right would essentially cross each note as it was to be played by the assigned instruments. If each instrumentalist follows their part based on the beats (timing) directed by the conductor, a lush and grand ‘aural experience’ is heard. You don’t have to know how to read this in order to enjoy it, but if you can read it, it changes the experience. That change can be for the better or worse. Better if what they read corresponds to what is being heard. If however, it doesn’t correspond, you then realize that there are mistakes or excessive liberties being taken because you essentially have the musical blueprint in front of you. I can’t count the number of CD’s or downloads I’ve purchased for scores that I own, hoping that I’ll find one that corresponds to the score that I have. Sometimes, I may enjoy a performance despite deviations from the score, so the issue isn’t perfection but rather reaching the best outcome
So in a similar way, a good UX designer will be observing, knowing the rules and seeing how users follow or ignore or break them and then ask why. All of the ‘whys’. The object, the individual’s abilities or previous experience or lack of it, the interrelationships of tangible and intangible attributes and so on. The more information the UX designer has to draw upon and apply, the better the UX is likely to be
Experience defined
Technically, experience is anything that you have been exposed to and received some sort of sensory input. The level to which it is remembered, contextually defined, cognitively analyzed and more importantly applied, interpreted and deconstructed determines the level on whether the experience qualifies as “professional” or not.
Two different people can be in the same place at the same time, during the same intentionally pleasant event (a fireworks display, a concert, the unveiling of a new architectural structure, a scenic overview, a new tech toy, etc.) and be exposed to the same sensory input. (For the sake of the argument here, let’s not delve into the fine deviation of the fact that they may be standing 18 inches apart or that the presence of the other person; one being to the left of the other while the other being to the right of the prior mentioned person. I realize that these can be important factors for a number of reasons, but not for the sake of this argument.) Let’s assume that one person (Person A) is in a professional field that requires observations of subjective details and reasonable speculative inference on the how’s and whys of the event. The other is in a profession the deals primarily in assessing empirical data. The second person (Person B) is experiencing the same event as person A. Both will have certain emotional reactions that are similar or different based on their entire life experience. These emotional experiences, both good, bad, or merely relational, may or may not overlap regardless of the reasons behind them.
The difference I refer to regarding UX is that Person A is more likely to not simply take in the sensory input and just enjoy it. They are likely to start analyzing how it does or might work, what makes some aspect relate to another aspect, what is or isn’t intentional, what’s the science/math/physics/aesthetics/history that preceded and influenced it. Then they will think how it is better or needs to be improved, how can it be applied in other situations, temporal questions of why here and now. Person B is more likely to simply enjoy the event.
Any good critical thinker (and there unfortunately fewer than you might think) will be able to maintain the balance between pleasure/satisfaction and cynicism. This is essential to UX design. It is one of the foundations behind “You are not the user” because it guides you to be more objective, even if the subject is an emotional one. Empathy is a powerful tool in this aspect, but without the balance of detachment, the observer part of the UX designer is likely to project their own emotions onto the participant.
Data: Qualitative and Quantitative
Quantitative data is easy. It is only a clearly defined set of numbers. How many passed, and how many failed. That’s oversimplifying it, but it makes the basic definition clear.
The issues with gathering quantitative data in surveys, (assuming that it’s honest data) is whether the right questions are asked and whether the questions asked are worded and presented neutrally. In gathering observational quantitative data the most common issue is accuracy of the method of gathering the information (e.g. sample size, appropriate demographic targets, simple math errors, etc.)
Qualitative data is very important in UX design since it’s usually the part that addresses the experiential/emotional aspects of the UX. One of the largest obstacles for qualitative data is that since it can’t be statistically analyzed, it is often given far less weight when determining the UX of a product. Sometimes it is dismissed entirely. One of my early mentors once said during a presentation where changing from a black and white display to a color one (in the context of the application it would be used for) will not improve the usability of the product, but, that it should be considered for a more important reason: users like ‘color’. They find more satisfaction in using a color display over a black and white one when there are no color based attributes that would improve the usability. They will also perceive it to be of better quality even though there is no change in function or ease of use.
A different problem with qualitative data is that sometimes it’s improperly defined and incorrectly ascribed as quantitative data. When questions are not clearly defined or arbitrarily defined. For example, affluence and socioeconomic level data is often incorrectly defined in this way. This can become precarious when one considers that socioeconomic class definitions vary geographically. Additionally, what are the measurements used to determine these levels. Then there’s the self-determined reference (which will probably give you more information on state of the individuals ego rather than any true measure of affluence).
Lastly, in terms of UX design specifically, you can’t use the same levels or types of satisfaction across the board to measuring the success of a task. It is easy to fall into the trap of marketing vs. satisfying user experience. For example, UX designers are often asked to design a UI that delights the customer. This is sometimes completely contrary to an exceptional user experience. A task to be completed in a business application will produce a great user experience if the user is able to accomplish their task with as little thought about the application as possible. You don’t try to make a phone ‘fun to dial’, because the user’s intent when using a phone is to talk to someone, not to ‘have fun’ dialing their number.
User Testing
This is not a user testing “how to”, but rather points out the need for balance and understanding of the data you’re gathering and using.
When doing user testing, the methods are going to vary depending on everything from budgets to testing methodologies. Personally, I like to start with existing data and validating how it was gathered. Hopefully there is some, and if not that’s where I’ll start. I’ll make sure that I’ve clearly defined what is quantitative and what is qualitative. Quantitative tells me if something works or not, but qualitative tells me whether or not something matters or not regardless of effectiveness. It is also one of the better determinants of helping to create focus which is critical to new product development and MVP. Good research of qualitative data will tell me if the products biggest advertised feature is actually tangential to the experience. Paying attention to such things can indicate the need for a pivot in design and focus before they become very expensive (high cost with little or no return.)
I have personally gathered more usable and actionable qualitative data by focusing primarily on observation and then following up with a few questions based on the observations. This type of feedback is targeted specifically to the individuals for clarification. They can give me insights as to the ‘whys’ of actions taken. They are never used as quantitative data. Much of UX is based on quantitative data. I’ve found that certain problems were drawing a great deal of resources for fixing that were of insignificant importance to most users. These were not the infrequent but critical need functions (e.g. safety issues, calling 911, etc.) but rather functions that were far more important to the designers than the users and often weren’t dependent upon user critical functions.
Conclusion – Maintaining the balance.
A good way to self monitor this balancing act is ask your self during data gathering “What assumptions am I making?” If you say “None” you failed. So what you should regularly do is list the assumptions and track them from iteration to iteration and from project to project. This way you can identify and address potentially limiting patterns that people naturally develop.
Depending on the length of the development cycle, significant quantitative data is gathered at the very beginning of the design process, and again at the end after deployment. I’m excluding QA bug fix types of data that need to be done mid process.
Qualitative data is gathered, assessed, addressed with each iteration in the development cycle. This is often because correcting or improving an attribute of good UX design needs to be monitored to make sure that there are no snowball effects of the change. Conversely, it could create a well-reasoned change in the overall UX design.


Great article Bob, thanks! In your third paragraph under the Data section, you use the word quantitative instead of qualitative.”Quantitative data is very important in UX design since it’s usually the part that addresses the experiential/emotional aspects of the UX. One of the largest obstacles for quantitative data is that since it can’t be statistically analyzed…”. Is this what you meant? It seems the quantitative data by definition can be statistically analyzed. Did I miss something? Or did you mean the reverse?
You are correct. In that instance, “qualitative” is the intended word. Unfortunately, spellchecker is unaware of my dyslexia. Thank you, Mario, for the clarification.